Archive for the ‘Google Analytics’ Category
Google Analytics Summit 2014: What’s Next And On The Horizon For Analytics
Wednesday, May 28, 2014
As they have for years, Google Analytics Certified Partners, Premium customers and developers will once again join us in the Bay Area for our annual summit this week. We are constantly working to improve our products based on feedback from our most dedicated users and this event lets us hear directly from our community. We wanted to share an overview of some of the tools and features we’ll discuss at the 2014 summit so that even if you aren’t able to attend, you can about hear what’s next.
Enhanced Ecommerce
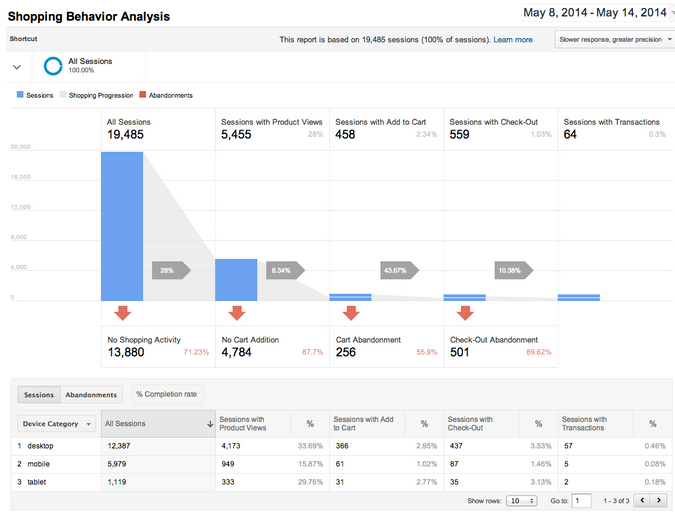
Google Analytics Ecommerce data traditionally focused on details about the purchase – transaction details, product details, and others. But, marketers today want to understand the entire customer journey. They want more details about customer behavior when looking at products, interacting with merchandising units and on-site marketing. Today we’re announcing the beta for Enhanced Ecommerce – a complete revamp of how Google Analytics measures the Ecommerce experience.
Businesses can now gain clear insight into new important metrics about shopper behavior and conversion including: product detail views, ‘add to cart’ actions, internal campaign clicks, the success of internal merchandising tools, the checkout process, and purchase. Merchants will be able to understand how far along users get in the buying process and where they are dropping off. For a complete overview of new features, have a look at our Help Center.
For marketers and Ecommerce managers looking to hone their analytic skills, we are also announcing a new Analytics Academy course titled Ecommerce Analytics: From Data to Decisions. Students will be guided through interactive examples of analyses for a fictional retail company to practice techniques they can apply to their own business. You can sign-up to be notified when this course opens on the Analytics Academy site.
Flexible and Scalable Reporting
Today’s marketers and analysts are looking to multiple data sets to gain deeper insights. We’re working on a number of new features to make it simple for businesses to work with different types of data in Google Analytics.
- We unveiled Unified Channel Groupings to ensure all traffic that comes to the your site are classified in-line with your unique channel definitions. This is especially valuable for attribution, so marketers can interpret and report on the consumer journey based on their unique view of acquisition channels.
- We’ve expanded the functionality of Google Analytics Dimension Widening, now called ‘Data Import’, to enable customers to import more of their own data into Google Analytics. This could include specific product details, information about returned products, insights about your customers’ preferences, and more. Imported data can be used with almost all of the standard Google Analytics features. For a complete list of the types of data you can import please see our article in the help center (linked above).
- For Google Analytics Premium users, we’re introducing Custom Tables. This powerful feature enables users to retrieve unsampled data using customized tables that best fit their business’ needs. Once configured, fresh data will be available daily for unsampled analysis and segmentation.
Enterprise-Class Features
Today, smart marketers are increasingly tying measurement to media execution. We’re excited to announce a seamless integration between Google Analytics Premium, DoubleClick Campaign Manager and DoubleClick Bid Manager. Google Analytics Premium is uniquely positioned to help today’s advertiser understand how customers, and potential customers, interact with advertising media trafficked on the DoubleClick platform. In addition to understanding impression level data, advertisers can now send remarketing lists from Google Analytics to DoubleClick Bid Manager.
We added Google Analytics Premium and DoubleClick Bid Manager integration this year in order to further optimize our strongest lead generating campaigns. 70% of our display leads come from our retargeting campaigns, and the Google Analytics Premium and DoubleClick Bid Manager integration allows us to move beyond optimizing by site and creative, to quickly personalizing creatives – optimizing using our knowledge of distinct visitor segments not just generic visits.
-Melissa Shusterman, Strategic Engagement Director, MaassMedia
Additionally, for enterprise customers, service providers, or developers that manage many accounts we are offering 4 new APIs to help you save you time and increase productivity: the new Provisioning API to create new GA accounts (invite only), the AdWords and Filters API to manage configurations, and the Embed API to surface key reports and dashboards. We’ve also re-launched the App Gallery as the Partner Gallery, the new destination to find Services by Google Analytics Certified Partners and Apps by Google Analytics Technology Partners. The new gallery will rollout to all users over the coming week.
Stay tuned in the next several days for deep-dives about our various new tools and features. You can also sign-up for the whitelist of several of the features listed above here. Thank you to our partners, developers, and customers for all the great feedback over the year. We hope to continue developing and launches capabilities that matters to you most.
Posted by the Google Analytics team


Comments (0)
Google Analytics Premium launches executive-level business reporting
Tuesday, May 27, 2014
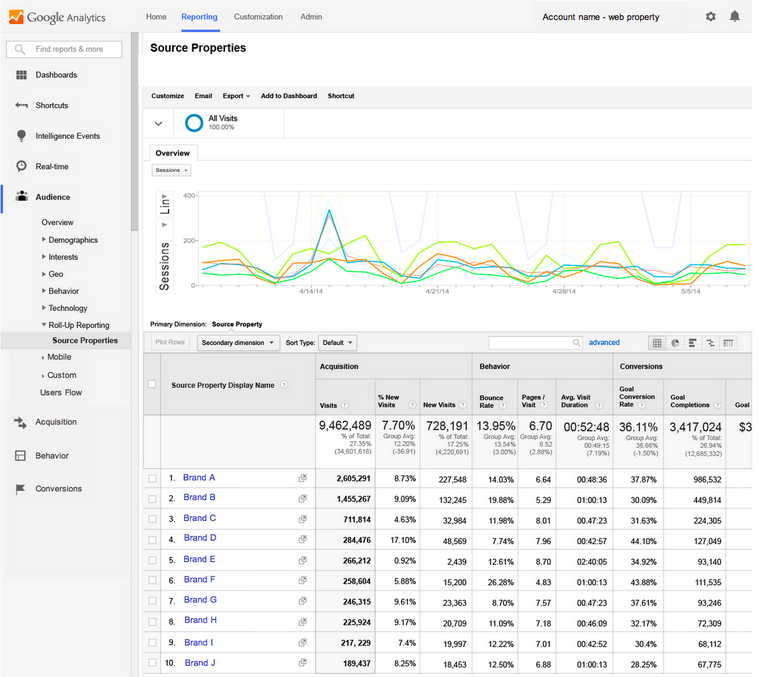
“Prior to using roll-up reporting we had no way to see all of our sites in a single Google Analytics view. Now we can easily compare our nine sites and react to trends in real time. This means that a product manager with a hunch about a new traffic pattern can quickly prove/disprove a theory without wasting hours of time pulling numbers for every site.” - Jesse Knight, VICE Media Group
Google Analytics already helps you gather deep insights into one website or app at a time. But what if you want to understand the overall performance and interactions of all your company’s digital properties? In today’s multi-touchpoint consumer world, this is a much greater priority.
Today we’re launching Roll-Up Reporting in Google Analytics Premium to help address this need. Roll-Up Reporting is a single interface that moves your aggregate business data much closer to your high-level business decisions.
The Executive Dashboard
One spot with aggregate data for all your sites and apps? Check. Key summaries with no compromises on data accuracy and segmentation? Check. Everything available in real time? Check. With Roll-Up Reporting, there’s no need to export from dozens of properties and collate data offline. It’s all built in.
Spot Overperforming Business Units
Suppose you want to compare the performance of the sites and apps for your company’s various brands, franchises or regional subsidiaries. The new Source Properties Report has you covered, with at-a-glance views of business units that are outperforming or underperforming. To compare specific segments, try using the new Source Property Display Name dimension in advanced segments, in custom reports, or as a secondary dimension.
A Single View of Your Customer Journey
In many cases, Roll-Up Reporting can de-duplicate unique visitors across your websites and apps, so you can see the total unique-visitor reach of all your digital properties. You can also use segments to study the overlap and pathing of visitors who traverse several of your sites and apps. If your business owns multiple brands or franchises that target similar consumer populations, or if you expect the same consumer to interact with multiple marketing or landing sites over time, be sure to try this out.
This is also a great way to tie together platform and device touchpoints. Google Analytics already provides powerful features, like cross device reports and single-view app and web data, to help you report on multiple types together. With Roll-Up Reporting, you’re no longer restricted to reporting on those tied to the same Google Analytics Property. That means more agile setups and more powerful analysis.
Fast Setup:
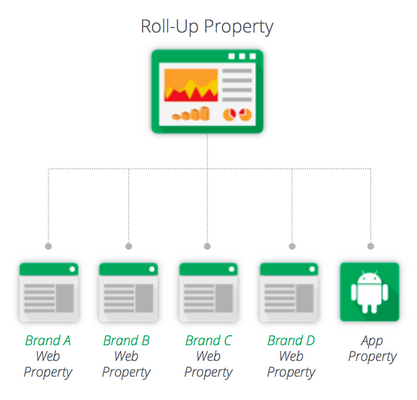
Roll-Up Reporting is made possible by Roll-Up Properties, a special type of Google Analytics property whose hit data comes exclusively from other Analytics properties. Setting up a Roll-Up Property is straightforward: no tagging changes needed. Simply select the Google Analytics properties that need to be reported on together, and Google Analytics will configure each selected property, called a Source Property, to forward a modified copy of all future hits it receives to the Roll-Up Property.
To get started with Roll-Up Reporting, contact your Google Analytics Premium Account Manager to request your new Roll-Up Properties.
To learn even more about Google Analytics Premium, contact your Google Account Manager or visit google.com/analytics/premium.
Posted by Yi Han, on behalf of the Google Analytics Premium team

Google Analytics Conference Nordic in Stockholm, Sweden
Monday, May 19, 2014
Join the Google Analytics Certified Partners for Google Analytics Conference Nordic in Sweden.
The event takes place August 28-29 in Stockholm, Sweden. You can expect to hear expert tips on how to get maximum value out of Google Analytics, and learn from other organizations using the tool.
Started based on an initiative by Outfox, who gathered the other Google Analytics Certified Partners, the conference is now returning for the fourth consecutive year.
Our Stockholm conference includes:
• Clinics led by Google Analytics Certified Partners
• Case studies from businesses and other organizations
• Opportunities to interact with peers and experts
• …much more!
The conference is being visited by two top speakers from Google, Daniel Waisberg and Kerri Jacobs.
Daniel Waisberg is the Analytics Advocate at Google, where he is responsible for fostering Google Analytics by educating and inspiring Online Marketing professionals. Both at Google and his previous positions, Daniel has worked with some of the biggest Internet brands to measure and optimize online behavior.
Before kickstarting the Google Analytics Premium sales team, Kerri Jacobs was a Sales Manager for the DoubleClick publisher, agency and marketer product portfolio. Kerri has been a leader in the online sales world since the early days.
Besides meeting Google, you’ll meet Google Analytics Certified Partners Outfox, iProspect, Knowit, MediaAnalys, Netbooster, Klikki and Web Guide Partner. You will also meet and learn from several end users who use Google Analytics on a daily basis.
To join us in Stockholm August 28-29, visit the conference site and secure your ticket before it’s sold out again.
Posted by Lars Johansson, Google Analytics Certified Partner

Join us for a conversation on the future of digital advertising
Tuesday, May 13, 2014
Digital is no longer just another marketing channel. It’s a medium that’s changing the art of storytelling and reinventing the way companies connect with consumers.
How will digital advertising evolve next? You’re invited to tune in live as industry leaders tackle the question at DoubleClick’s annual event on digital trends.
Speakers include:
- Jeffrey Katzenberg, CEO of DreamWorks Animation
- Nikesh Arora, Chief Business Officer at Google
- Neal Mohan, VP of Display Advertising at Google
Wednesday, June 4
9:30 am PDT – 10:45 am PDT / 12:30 pm EDT – 1:45 pm EDT
Time not convenient? When you register you’ll receive a link to watch the recording on demand.
We hope you can join!
Here’s footage from last year’s event to give you a taste of the 2014 live stream:
Posted by Aditi Rajaram, Google Analytics team

Introducing Content Grouping in the Behavior Flow
Monday, May 12, 2014
Many of you have shared with us that it’s difficult to identify traffic patterns from Behavior Flows that include a large number of pages. That’s why we’re pleased to announce that we’re adding support for Content Groupings in the Behavior Flow.
Content Groupings let you group pages and content into a logical structure that reflects how you think about your site. The Behavior Flow view provides a graphical representation of how visitors flow through your site by traffic source (or any other dimension) so you can see their journeys, as well as where they dropped off. Now, you can select Content Groupings in the Behavior Flow to see how visitors flow through Content Groupings that you have defined. This can help you answer questions like “Where do users who read my sports pages go next? Do they view more sports articles or do they switch to another section? Or, do they simply drop off?”
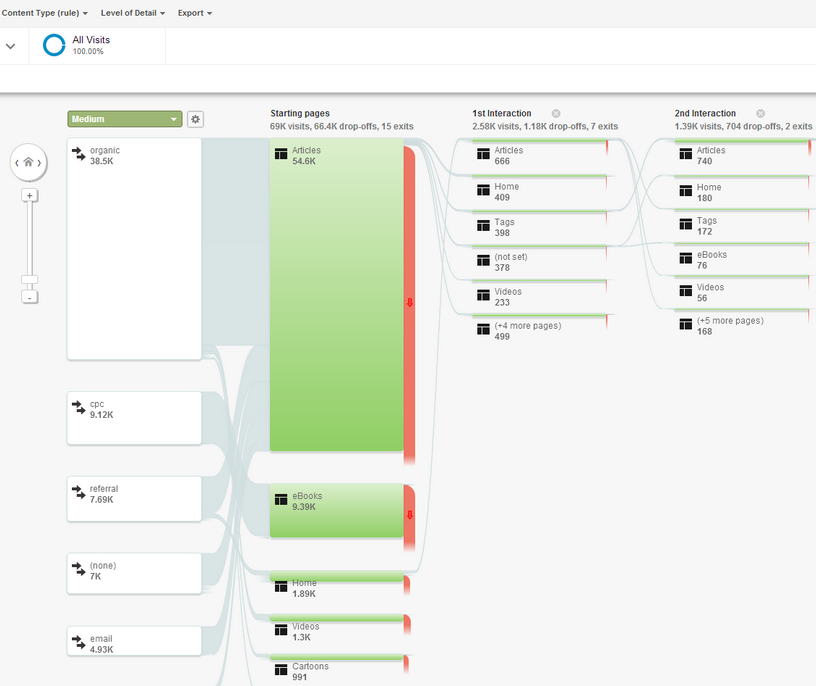
The more time you spend setting up your Content Groupings, the more information you will be able to discover from viewing them in the Behavior Flow. Watch the video to learn more about setting up Content Groupings.
Visit our Help Center to learn how to get started with Content Groupings, or read this article about using the Behavior Flow once you have set up your Content Groupings.
Happy Analyzing!
Posted by Matthew Anderson, Google Analytics Team

The Power Of Segmentation And Mobile App Analytics
Thursday, May 1, 2014
A few weeks ago I presented at the Google Developer Summit in London, where members of the Google Developer Relations team discussed several ways to use our tools to their best.
In my presentation (below), I discussed the power of segmentation and proposed a way to look at it in two different ways:
- Mission Driven Segmentation: some of the features in Google Analytics depend on implementation, and they start working from the moment you implement/configure them, so they are important for repetitive segmentation tasks. Examples are creating views for specific traffic sources / GEO locations or creating custom dimensions to measure attributes of customer engagement.
- On The Fly Segmentation: segmentation can’t always be planned, sometimes you might have special requests that you need to do “right now”. For this purpose, you can create new segments, which are extremely important for exploratory analyses.
Spoiler: I used two Lego building case studies to exemplify the two types of segmentation.

Below is the full presentation (thanks for the intro Richard Hyndman!), if you would like to watch all presentations from the event, here is a playlist.
Posted by Daniel Waisberg, Analytics Advocate

Sharing is Caring – Unleash your productivity with asset sharing in Google Analytics
Wednesday, April 23, 2014

Innovation happens on every level
Within your organization there are multiple people working on different sides of the same problem. Making it easy for people to quickly and effectively share innovative solutions is a key enabler for more productivity, and better decisions.
We are proud to announce a series of asset sharing tools within Google Analytics. To spread all your innovative solutions and assets even easier. Our permalink solution is a simple to use and privacy friendly way to share Google Analytics configurations across your organization, and beyond.
Narrow the focus for precise insights
Our popular segments feature helps you to narrow the focus of your analysis. Are you trying to answer a hypotheses for new, or recurring customers? Is this report more meaningful if you focus on a particular region? By sharing a segment, you share a certain point of view on a problem. Invite others to your view by sharing a segment you built, or a custom report.
Define success, and spread the love
Goals in Google Analytics help advertisers to map real business value into a conversion signal. Track users site engagement, media interactions, or sales events through Goal tracking. Now it is easier than ever to share your success definition across other views, or with other people in your organization.
Capture everything with Custom Channels Groupings
It all starts with traffic to your website. You spend a tremendous amount of effort and resources on getting people to visit. Custom Channel Grouping within Multi-Channel Funnels enables you to identify everything, especially traffic that is custom to your business model. Sharing this important view is now easier than ever. Create a Custom Channel Grouping, and share this among your organization.
Assign partial value to your marketing efforts
Custom Attribution Models allow Google Analytics users to assign partial value to the channel interactions which drive business value. You invest time and effort to build a customized attribution model, which reflects the nuances of your business. Now it is easier than ever to ensure all stakeholders are working off the same consistent definition of attribution.
“Amazing feature! I tried it … and like it.”
Sebastian Pospischil Director Digital Analytics, United Digital Group
How it works
Permalink is a simple to use, and privacy friendly way to share configuration assets. When you ‘share’ an asset, we are creating a copy of that asset or configuration, and create a unique URL which points to that copy. The asset copy will remain private and can only be accessed by someone with the URL. If you want to share your asset, just share the URL. The recipient clicks on the URL, and will be brought to a simple dialog to import the assets into his or her Google Analytics views. This feature also supports Dashboard, and Custom Reports.
Check out our Solutions Gallery within your Google Analytics account via the “Import from Gallery” button or directly at the standalone site for inspiration, and consider sharing your own permalinks via the “Share in Solutions Gallery” link.
Happy Analyzing.
Posted by Stefan Schnabl, on behalf of the Google Analytics team

Understanding multi-device user behavior in a single view
Thursday, April 17, 2014
In this constantly connected world, users can interact with your business across many digital touchpoints: websites, mobile apps, web apps, and other digital devices. So to help you understand what users do in the increasingly diverse digital landscape, we’re enabling the ability to see web and app data in the same reporting view.

Here’s a bit more detail on this change:
Analyze app and web data in the same reporting view
Now you can see all data you send to one Google Analytics property in a single reporting view, regardless of the collection method you use of where the data comes from. If you send data from the web and from a mobile app to one property, both data sets appear in your reports.
If you want to isolate data from one source, like if you only want to see web data in your reports, you can set up a filter to customize what you see. You can also use other tools to isolate each data set, including customizations in standard reports, dashboards, custom reports, and secondary dimensions.
If you don’t send web and app data to the same property, this change doesn’t affect your data or your account.
Measure web apps
We’ve also added some new app-specific fields to the analytics.js JavaScript web collection library, including screen name, app name, app version, and exception tracking. These changes allow the JavaScript tracking code to take advantage of the app tracking framework, so you can more accurately collect data on your web apps.
Benefit from consistent dimension & metrics names
Until today, some metrics and dimensions used different names in app views and in web views, even though they presented the exact same data. Now, all metric, dimensions, and segment names are the same, regardless if they’re used for web or app data. This gives you a clear and consistent way to analyze and refer to all of your Google Analytics data.
Visitors are now users and visits are sessions:
There are two big changes to the names in Google Analytics: First, the Visitors web metric and Active Users app metric are now unified under the same name, Users. And second, Visits are now referred to as Sessions everywhere in all of Google Analytics.
We’ll be making these changes starting today, and rolling them out incrementally over the next week. Visit our developer site for more information on these changes:
- Read the full list of dimension and metric names
- App / Screen Tracking developer guide
- Exception Tracking developer guide
Posted by Nick Mihailovski, Product Manager

Improving Your Data Quality: Google Analytics Diagnostics
Monday, April 14, 2014
Google Analytics is a powerful product with a wealth of features. Analytics data can fuel powerful actions like improving websites, streamlining mobile apps, and optimizing marketing investment. To realize this power, you must configure Analytics well and ensure high quality data. For these reasons, we’re starting a beta test with some of our users on Analytics Diagnostics that are aimed at finding data-quality issues, making you aware of them, and helping you fix them.
Analytics Diagnostics frequently scans for problems. It inspects your site tagging, account configuration, and reporting data for potential data-quality issues, looking for things like:
- Missing or malformed Analytics tags
- Filters that conflict
- Looking for the presence of (other) entries in reports
Here’s what it looks like:
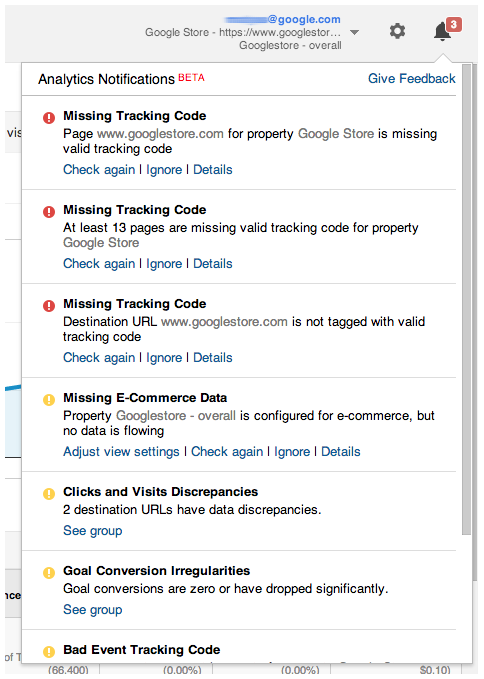
As we get lots more feedback and improve the diagnostics system, we will release this to all of our users. It will take some time to get there; in the meantime, you are welcome to express interest in trying out the diagnostics system on your own GA accounts.
Posted by the Google Analytics Team

New user and sequence based segments in the Core Reporting API
Friday, April 11, 2014
Segmentation is one of the most powerful analysis techniques in Google Analytics. It’s core to understanding your users, and allows you to make better marketing decisions. Using segmentation, you can uncover new insights such as:
- How loyalty impacts content consumption
- How search terms vary by region
- How conversion rates differ across demographics
Last year, we announced a new version of segments that included a number of new features.
Today, we’ve added this powerful functionality to the Google Analytics Core Reporting API. Here’s an overview of the new capabilities we added:
User Segmentation
Previously, advanced segments were solely based on sessions. With the new functionality in the API, you can now define user-based segments to answer questions like “How many users had more than $1,000 in revenue across all transactions in the date range?”
Example: &segment=users::condition::ga:transactionRevenue>1000
Try it in the Query Explorer.
Sequence-based Segments
Sequence-based segments provide an easy way to segment users based on a series of interactions. With the API, you can now define segments to answer questions like “How many users started at page 1, then later, in a different session, made a transaction?”
Example: segment=users::sequence::ga:pagePath==/shop/search;->>perHit::ga:transactionRevenue>10
Try it in the Query Explorer.
New Operators
To simplify building segments, we added a bunch of new operators to simplify filtering on dimensions whose values are numbers, and limiting metric values within ranges. Additionally, we updated segment definitions in the Management API segments collection.
Partner Solutions
Padicode, one of our Google Analytics Technology Partners, used the new sequence-based segments API feature in their funnel analysis product they call PadiTrack.
PadiTrack allows Google Analytics customers to create ad-hoc funnels to identify user flow bottlenecks. By fixing these bottlenecks, customers can improve performance, and increase overall conversion rate.
The tool is easy to use and allows customers to define an ad-hoc sequence of steps. The tool uses the Google Analytics API to report how many users completed, or abandoned, each step.

Funnel Analysis Report in PadiTrack
According to Claudiu Murariu, founder of Padicode, “For us, the new API has opened the gates for advanced reporting outside the Google Analytics interface. The ability to be able to do a quick query and find out how many people added a product to the shopping cart and at a later time purchased the products, allows managers, analysts and marketers to easily understand completion and abandonment rates. Now, analysis is about people and not abstract terms such as visits.”
The PadiTrack conversion funnel analysis tool is free to use. Learn more about PadiTrack on their website.
Resources
- Read the segmentation conceptual guide to learn how these new segments work.
- Get started with the segments developer guide.
- Understand the richness of the segments language in the reference guide.
We’re looking forward to seeing what people build using this powerful new functionality.
Posted by Nick Mihailovski, Product Manager, Google Analytics team

Recent Comments